GraphViz Composer
One important type of code is found in many free diagramming\graphics tools like GraphViz, OpenSCAD, and POVRay. Using basic functionality of the TextComposerLib classes we can generate code for these useful software systems based on internal computations of choice. This is very useful for simple and effective integration for data visualization and graphing tasks. Although we can use the general text composers explained in previous sections for this task, some special classes were created in the TextComposerLib for simplifying code generation for specific software. In the future more will be added for generating code for other diagramming and data visualization systems.
GraphViz is a very useful library for visualizing graphs that is used by many software projects for various information presentation tasks. The TextComposerLib contains a wrapper for the GraphViz library to generate its source code (in GraphViz’s dot DSL) and to render the generated code into an actual graph image if GraphViz is installed on the machine. GraphViz composer adds a layer of .NET managed code upon the GraphViz library to make the creation of dot code and rendering of graphs easier to use. To fully appreciate the capabilities of this composer we need to read the GraphViz manual pages first and the rest is simple to understand. The main object to start creating dot code is the DotGraph class under the TextComposerLib.GraphViz.Dot namespace that creates the main graph. Most graph, node, edge, and cluster attributes are added using extension methods that can be found under the TextComposerLib.GraphViz.Dot.CodeBuilder namespace. After describing all the nodes, edges, clusters, and sub-graphs we need under the main graph we can call the GenerateDotCode() method of the DotGraph object to generate the required dot code as a string. We can render the graph’s dot code into an image using one of several built-in static renderers inside the GvRenderer class under the TextComposerLib.GraphViz namespace by specifying the GraphVizBinFolder property and calling the RenderToImage method with appropriate inputs.
![]()
The shown code will construct a main graph and generate the following dot code:
|
1 2 3 4 5 6 7 8 9 10 11 12 13 14 |
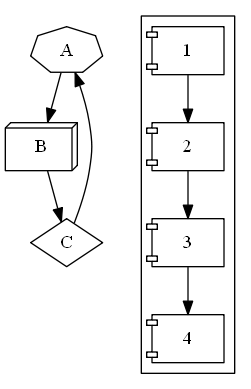
digraph { A [ shape = septagon ]; B [ shape = box3d ]; C [ shape = diamond ]; A -> B; B -> C; C -> A; node [ shape = component ]; subgraph cluster1 { 1 -> 2 -> 3 -> 4; } } |
If we render that code into an image we will get the graph:
|
1 2 3 4 5 6 7 8 9 10 11 12 13 14 15 16 |
_graph = DotGraph.Directed(); _graph.AddNode("A").SetShape(DotNodeShape.Septagon); _graph.AddNode("B").SetShape(DotNodeShape.Box3D); _graph.AddNode("C").SetShape(DotNodeShape.Circle); _graph.AddEdge("A", "B"); _graph.AddEdge("B", "C"); _graph.AddEdge("C", "A"); _graph.AddNodeDefaults().SetShape(DotNodeShape.Component); _graph.AddCluster("1").AddEdge("1", "2", "3", "4"); _graph.AddNode("C").SetShape(DotNodeShape.Diamond); return _graph.GenerateDotCode(); |